
SYDNEY, Australia – November 15, 2009 – The Tasmanian Irrigation Development Board (TIDB) have gone live with Zavanti’s Construction Enterprise Resource Planning (ERP) and Zavanti’s document collaboration and control solution based upon Weblogics’ products; Intralogic, EmailLogic and Blueprint.
TIDB selected Zavanti ERP in early 2009 after an open tender process, to manage all the activities for their 12 major projects with total infrastructure goals of $400m. The TIDB is tasked with the management to progress irrigation schemes from feasibility assessment through to the construction and operational stages to increase the irrigation supplies within Tasmania by 50%.
Since going live, the Zavanti ERP solutions provide the TIDB with a complete management solution from budgeting through to project completion. The solution allows TIDB to forecast expenditures out to 2019, whilst maintaining control of sub-contracts and cost commitments, also providing consolidated Board reports to ensure that the goals of the TIDB are being met.
Zavanti’s Weblogics solution allows the TIDB to manage all documentation, including Email traffic associated with projects, to ensure the security and control of information. Weblogics workflows are used to maintain all business processes associated with any project correspondence, guaranteeing traceability and security. Weblogics forms electronically allow users to submit requests and advices whilst version control of documents ensures all previous versions are accessible for comparison.
TIDB has successfully realised the value added by Zavanti ERP and Weblogics solutions, to better manage internal and external collaboration, streamlining their project and document management processes, and providing a communication platform for all project participants.
Ian Plater, Chairman of Zavanti said “This success confirms our strategy of providing a complete package of specialist solutions for the Real Estate and Construction industries ensuring that our clients obtain the highest return on their investment”.
ABOUT ZAVANTI
Zavanti combines superior consulting and industry expertise with world-class software applications, to provide a suite of solutions that cover Feasibility and Investment Planning ERP, Project and Portfolio Management and Performance Management. These powerful solution sets allow clients to minimise risk, control costs, increase efficiency, and facilitate the sharing of information, collaboration and planning.
Showing posts with label Performance Management Software. Show all posts
Showing posts with label Performance Management Software. Show all posts
15 November, 2009

19 October, 2009
Dashboard Spotlight: Trinity Technologies eliminates Manual Reporting with Corda
Coordinating and managing the integration of content management systems with other business applications across multiple clients posed a major challenge for integrator Trinity Technologies.
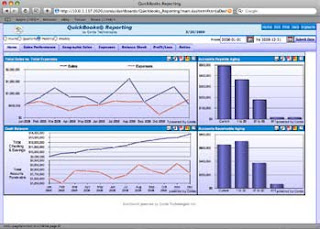
Each week, Trinity’s financial administrator was tasked with manually capturing data from QuickBooks, spreadsheets, an SQL database and other sources and creating a report. This task took, on average, three to four hours to complete each week and the information in the report could be up to a week old. In addition, the report didn’t clearly highlight areas demanding immediate attention because of its inadequate data visualisation. For example, companies over 90 days delinquent on payments needed to be flagged for immediate attention and action.
Projects that had used more than 80% of their budgets also needed to be flagged for attention by project leaders. Trinity determined it needed the power of an application that could capture data from multiple sources and represent theinformation visually, in real time, to promote better understanding.
After exploring other dashboard solutions on the market, Trinity implemented a Corda CenterView performance dashboard. CenterView was easy and fast to implement and the dashboard began immediately delivering ROI. Manual report development time was eliminated and now, the executive and project teams have anytime access to real-time information presented in a visual format that draws attention to actionable issues.
“Trinity gained a new level of control and corporate maturityby implementing CenterView,” said Joseph Morray, Trinity President. “While we see the potential for even greater internal returns, we also see a distinct market advantage for our own customers, who can, in turn, achieve significant reporting and tracking efficiencies on an enterprise level.”
Zavanti is the primary distributor for Corda Technologies in Australia and New Zealand. If you would like further information please contact Doug Harrison on 02 8080 4800 or visit www.corda.com
Each week, Trinity’s financial administrator was tasked with manually capturing data from QuickBooks, spreadsheets, an SQL database and other sources and creating a report. This task took, on average, three to four hours to complete each week and the information in the report could be up to a week old. In addition, the report didn’t clearly highlight areas demanding immediate attention because of its inadequate data visualisation. For example, companies over 90 days delinquent on payments needed to be flagged for immediate attention and action.
Projects that had used more than 80% of their budgets also needed to be flagged for attention by project leaders. Trinity determined it needed the power of an application that could capture data from multiple sources and represent theinformation visually, in real time, to promote better understanding.
After exploring other dashboard solutions on the market, Trinity implemented a Corda CenterView performance dashboard. CenterView was easy and fast to implement and the dashboard began immediately delivering ROI. Manual report development time was eliminated and now, the executive and project teams have anytime access to real-time information presented in a visual format that draws attention to actionable issues.
“Trinity gained a new level of control and corporate maturityby implementing CenterView,” said Joseph Morray, Trinity President. “While we see the potential for even greater internal returns, we also see a distinct market advantage for our own customers, who can, in turn, achieve significant reporting and tracking efficiencies on an enterprise level.”

Zavanti is the primary distributor for Corda Technologies in Australia and New Zealand. If you would like further information please contact Doug Harrison on 02 8080 4800 or visit www.corda.com

20 May, 2009
Corda Technologies usher in a new era in Data Visualisation and Performance Dashboards with CenterView 4.0
Corda Technologies, a leader in innovative, real-time data visualisation and performance dashboard software, have announced the release of CenterView 4.0. This new version features a number of enhancements and performance improvements that deliver enterprise-level performance dashboards and advanced visual business intelligence (BI) capabilities.
The new features in CenterView 4.0 provide even greater security and flexibility:
- Corda Mobile Server enhances the CenterView experience for mobile users, making it easier to create and deploy KPIs to mobile devices, supporting new devices, including the Apple iPhone and iPod Touch via the soon-to-be-released Corda Mobile on the iTunes App Store.
- Improved BusinessObjects Connector connects report data to a CenterView dashboard.
- Salesforce.com (SFDC) Connector lets you connect SFDC to your dashboard without having to build your own connector.
- Data visualisation enhancements include enhanced label placement for large data set graphs, including a 'best fit' option, legend headers, and more legend style controls.
- Significantly improved help on wiki.corda.com allows easy product and tutorial search as well as fast documentation updates.
For more information and to start a free trial of CenterView 4.0, Click Here.
"CenterView 4.0 is impressive from its major ease-of-use and performance advancements," said Neal Williams, Corda President and CEO. "Significant data connector additions and refinements as well as the introduction of Corda Mobile carry CenterView 4.0 into the realm of a major release.”
“We have delivered cutting-edge capabilities with CenterView 4.0, ushering in a new era in data visualisation and performance dashboards,” said Mark Christensen, Corda VP Sales and Marketing.
Corda Technologies is the leading provider of enterprise solutions for creating dashboards and interactive data visualisation solutions that enhance performance management and smart decision-making. For more than twelve years, Corda has led the evolution of data visualisation from static charts and graphs to interactive, intuitive strategic dashboards. Its award-winning solutions include developer tools, enterprise server products and professional services that improve business performance and enable customers worldwide to enhance bottom-line results. For more information please visit http://www.corda.com
Zavanti are the authorised reseller for Corda Products and Services in Australia and New Zealand
15 December, 2008
Work Smarter with Zavanti Enterprise Software

Our latest e-campaign for our Enterprise Software Solutions (above) focuses on Zavanti Portfolio Manager (Project and Portfolio Management) and Corda (Performance Dashboards).
With uncertain financial times meaning smaller budgets and leaner staff, market-leading organisations need to:
- Focus on the investments and projects that will generate the best return
- Take full advantage of resources
- Monitor and track Operational KPI's
- Manage Employee Performance
- Uncover untapped revenue
- Fully analyse data about customers, product and sales
Contact us today to learn more about these enterprise solutions and how we can help you power ahead and seize new opportunities in 2009.
27 October, 2008
Visual Evolution 2008 a success for Corda Technologies
Corda Technologies annual four-day Visual Evolution conference brought together executive dashboard and data visualisation users, developers, prospects and partners, along with industry leaders from around the globe, including Zavanti’s own Corda Developer, Jason Marshall.
Wayne Eckerson, author of “Performance Dashboards: Measuring, Monitoring, and Managing Your Business” was the keynote speaker for the event. Wayne is also the Director of Education and Research for The Data Warehousing Institute (TDWI). Other industry expert speakers included Ron Powell, Co-founder of The Business Intelligence Network, and Peter Traynor, Editor in Chief, Dashboard Insight.
Corda’s expert Dashboard Technologists delivered presentations on CenterView™, PopChart®, OptiMap™ and Highwire™, giving best practices for all levels of users and developers. In addition, participants attended sessions to learn how to create attractive dashboards, extend the dashboard interface, transform data from data funnels, and to explore best practices in choosing Key Performance Indicators (KPIs). They also participated in round table discussions, where they had the opportunity to learn from other users and developers, as well as case studies from leading industry executives.
The Data Visualisation Lounge was a new feature this year, here attendees could practice the tips and tricks learned at the conference, see how other customers are visualising business intelligence, or work on their own dashboard projects - with the help of expert Dashboard Technologists from Corda.
“Visual Evolution continues to be a terrific success as our signature annual event,” said John Purvis, CEO and president of Corda. “The world’s best minds in data visualisation, business performance management, and performance dashboards gather together to learn about and successively refine what it means to truly manage performance.”
Click here to access the session presentations from the event
Wayne Eckerson, author of “Performance Dashboards: Measuring, Monitoring, and Managing Your Business” was the keynote speaker for the event. Wayne is also the Director of Education and Research for The Data Warehousing Institute (TDWI). Other industry expert speakers included Ron Powell, Co-founder of The Business Intelligence Network, and Peter Traynor, Editor in Chief, Dashboard Insight.
Corda’s expert Dashboard Technologists delivered presentations on CenterView™, PopChart®, OptiMap™ and Highwire™, giving best practices for all levels of users and developers. In addition, participants attended sessions to learn how to create attractive dashboards, extend the dashboard interface, transform data from data funnels, and to explore best practices in choosing Key Performance Indicators (KPIs). They also participated in round table discussions, where they had the opportunity to learn from other users and developers, as well as case studies from leading industry executives.
The Data Visualisation Lounge was a new feature this year, here attendees could practice the tips and tricks learned at the conference, see how other customers are visualising business intelligence, or work on their own dashboard projects - with the help of expert Dashboard Technologists from Corda.
“Visual Evolution continues to be a terrific success as our signature annual event,” said John Purvis, CEO and president of Corda. “The world’s best minds in data visualisation, business performance management, and performance dashboards gather together to learn about and successively refine what it means to truly manage performance.”
Click here to access the session presentations from the event
Subscribe to:
Posts (Atom)